Comparing smartphone performance across Android OS versions
October 12, 2016

PCMark for Android is getting a major update tomorrow. We've already taken a closer look at the new Work 2.0 and Computer Vision benchmarks. In this post, we’ll present another new feature, the ability to compare scores across Android OS versions.
Android OS updates can breathe new life into older devices. New features and interface design changes can give a device a fresh, modern feel. While beneath the surface, driver optimizations and changes to the operating system can improve performance, stability, and battery life.
With this update, we're making it easier to see how Android OS updates affect a device's performance.
LG Nexus 5 and Samsung Galaxy S5 performance across three Android OS generations
In this post, we'll be digging into our database to take a detailed look at how the performance of two of the most popular smartphones has changed across three Android generations.
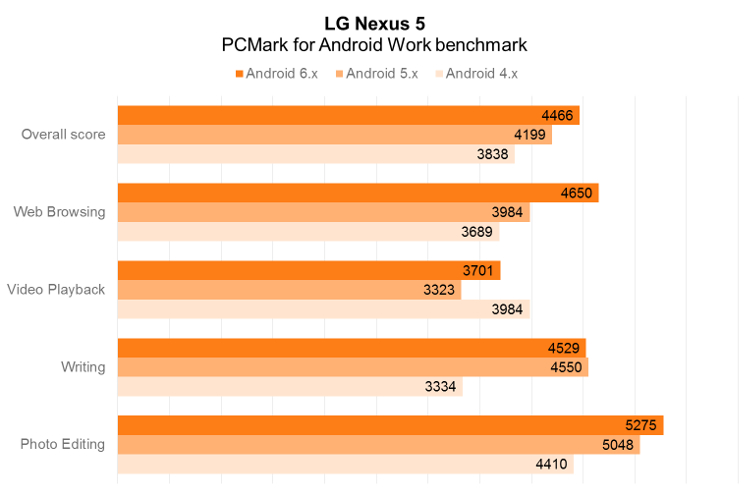
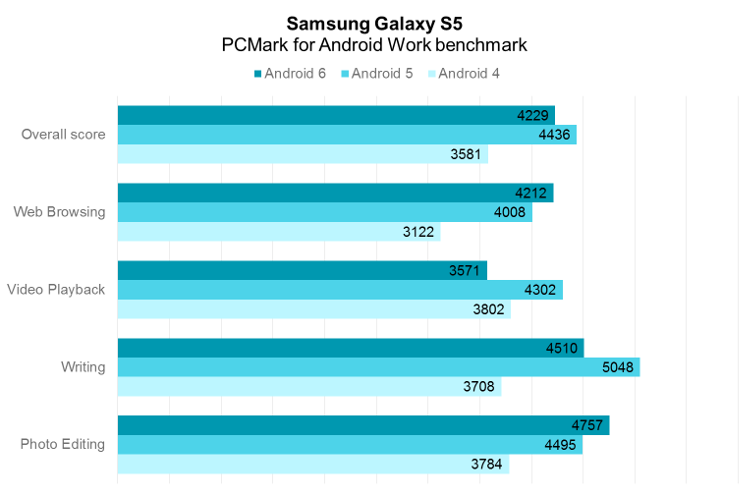
We looked into the PCMark for Android Work benchmark scores for the LG Nexus 5 and Samsung Galaxy S5 for Android versions 4.x, 5.x and 6.x.
As you can see, while the general trend is for performance to increase with each new OS version, the change varies by device and activity. In fact, for some tests you can see that performance decreased slightly after the update. It's worth remembering that some Android updates focus more on adding new features and functionality than performance.
In these charts, each score is the average of all the benchmarks results received for that model, with obvious outliers excluded. For a popular device, the average comes from thousands of individual benchmark results from users around the world.
For some devices, these individual benchmark scores can vary a lot. People often run benchmarks under less than ideal conditions, for example, with other apps running in the background, with a device that is already running hot or on a device that is poorly configured.
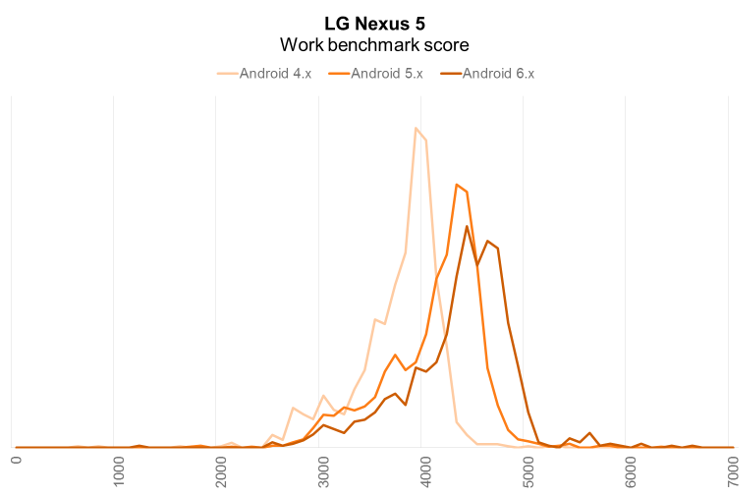
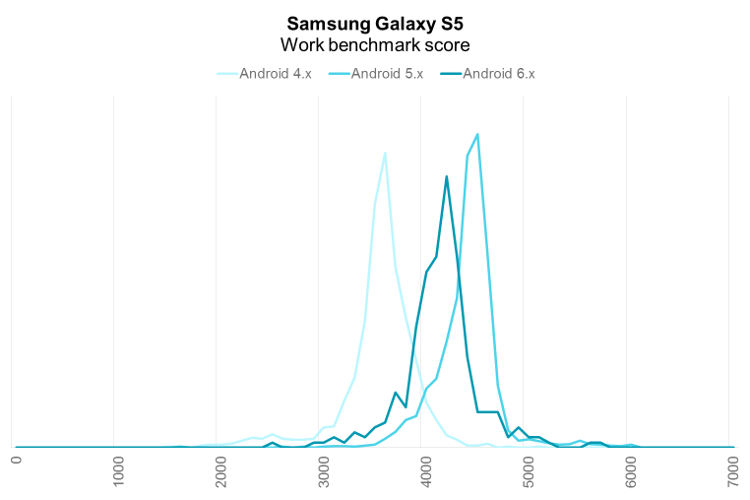
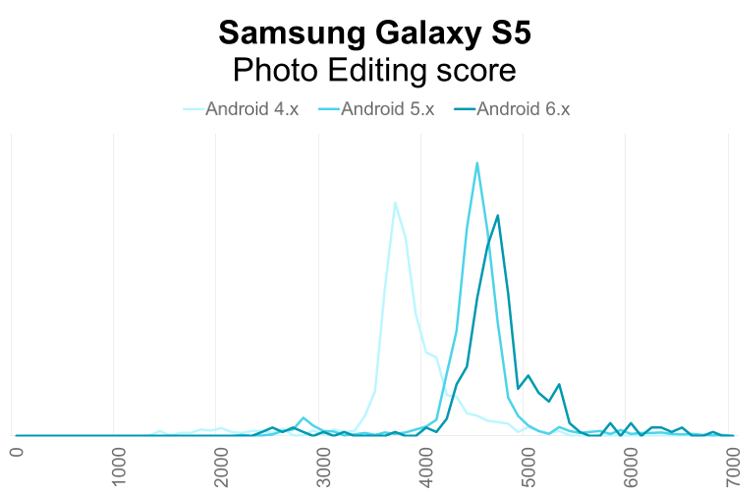
The charts below show the distribution of individual benchmark results for each model. The peak shows the most common score range.
For the LG Nexus 5, you can see that each Android OS update pushes the curve towards higher scores and better performance.
With the Galaxy S5, we see a much larger jump in performance from Android 4.x to 5.x. There is a slight drop in scores moving to Android 6.x, though this is based on limited data since the Android 6.0 update was only rolled out to Samsung S5 devices very recently.
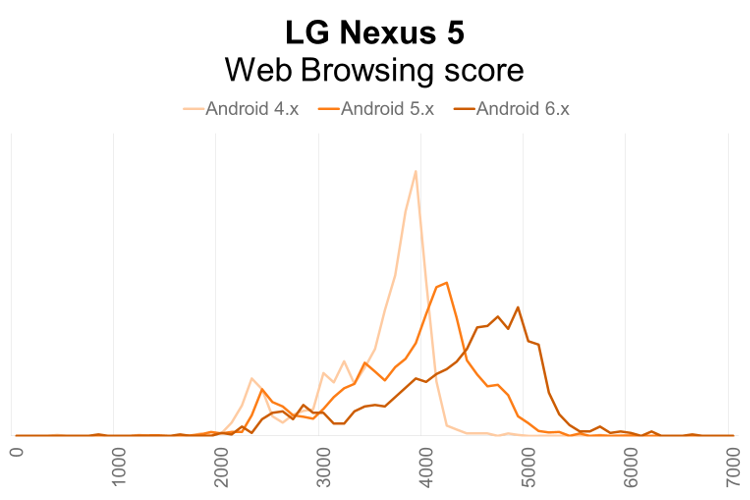
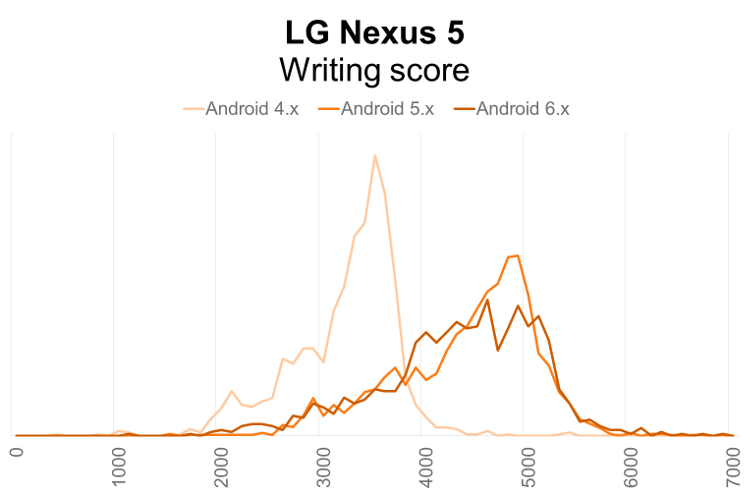
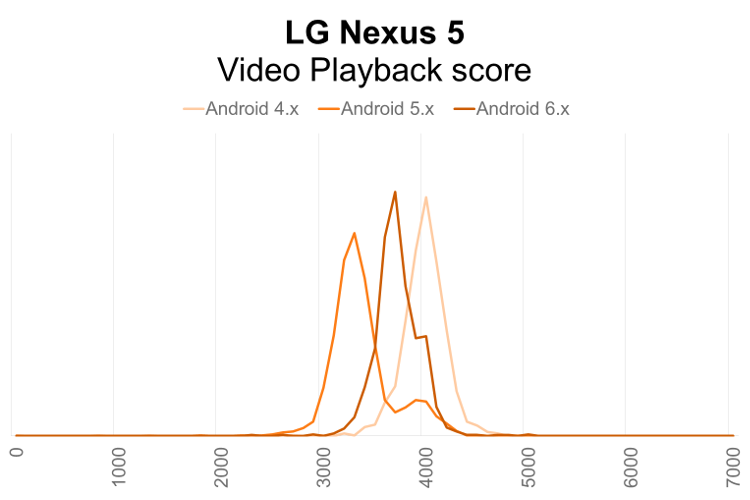
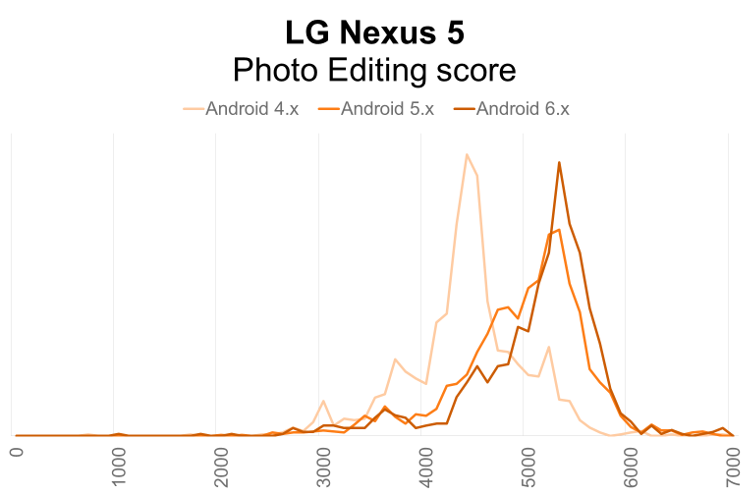
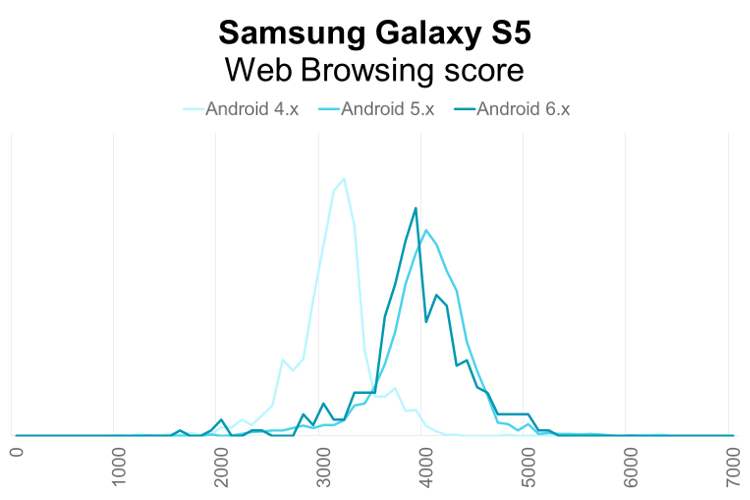
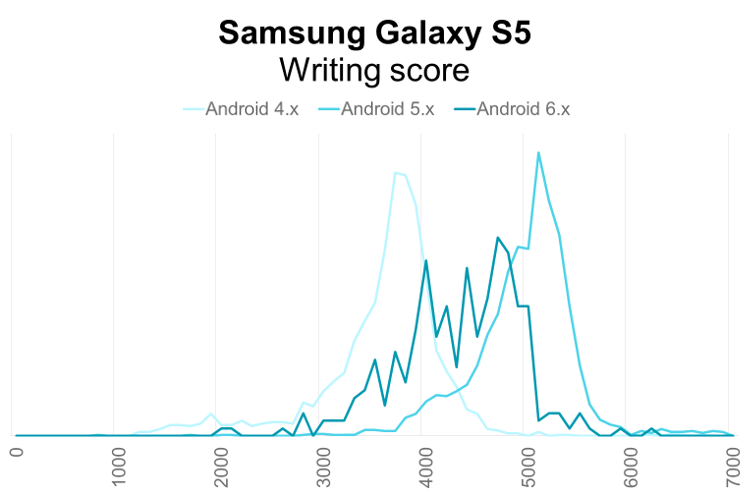
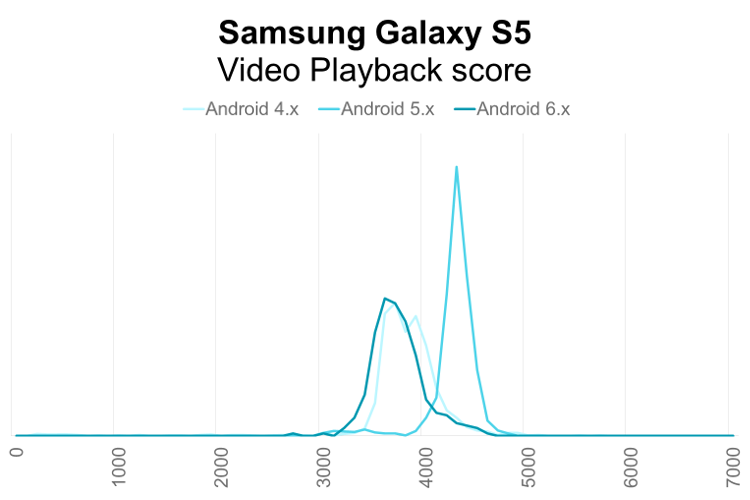
Next, we look at the performance for specific scenarios in the Work benchmark test, such as web browsing, video playback, writing and photo editing.
It's clear from these charts that one should not generalize when talking about the performance benefits of Android OS updates. The effects can vary greatly by device and by activity.
OS updates can make wide-reaching changes that affect the whole device. People assume that these updates will bring better performance, but we can see that this is not always the case for every activity. It is easy to misinterpret the benefits of an update if you rely on synthetic tests that only measure CPU performance in isolation.
By using a benchmark based on real-world tasks, you can see the areas where an OS update has the biggest impact. For some activities, there might be big improvements as a result of new drivers, OS optimizations or changes to APIs. In other areas, the performance might stay the same or even degrade.
PCMark for Android is the only benchmark app that can give you these insights into a device's real-world performance. And it will get even better tomorrow when we introduce our new Work 2.0 and Computer Vision benchmark tests.
Compare performance across Android OS versions
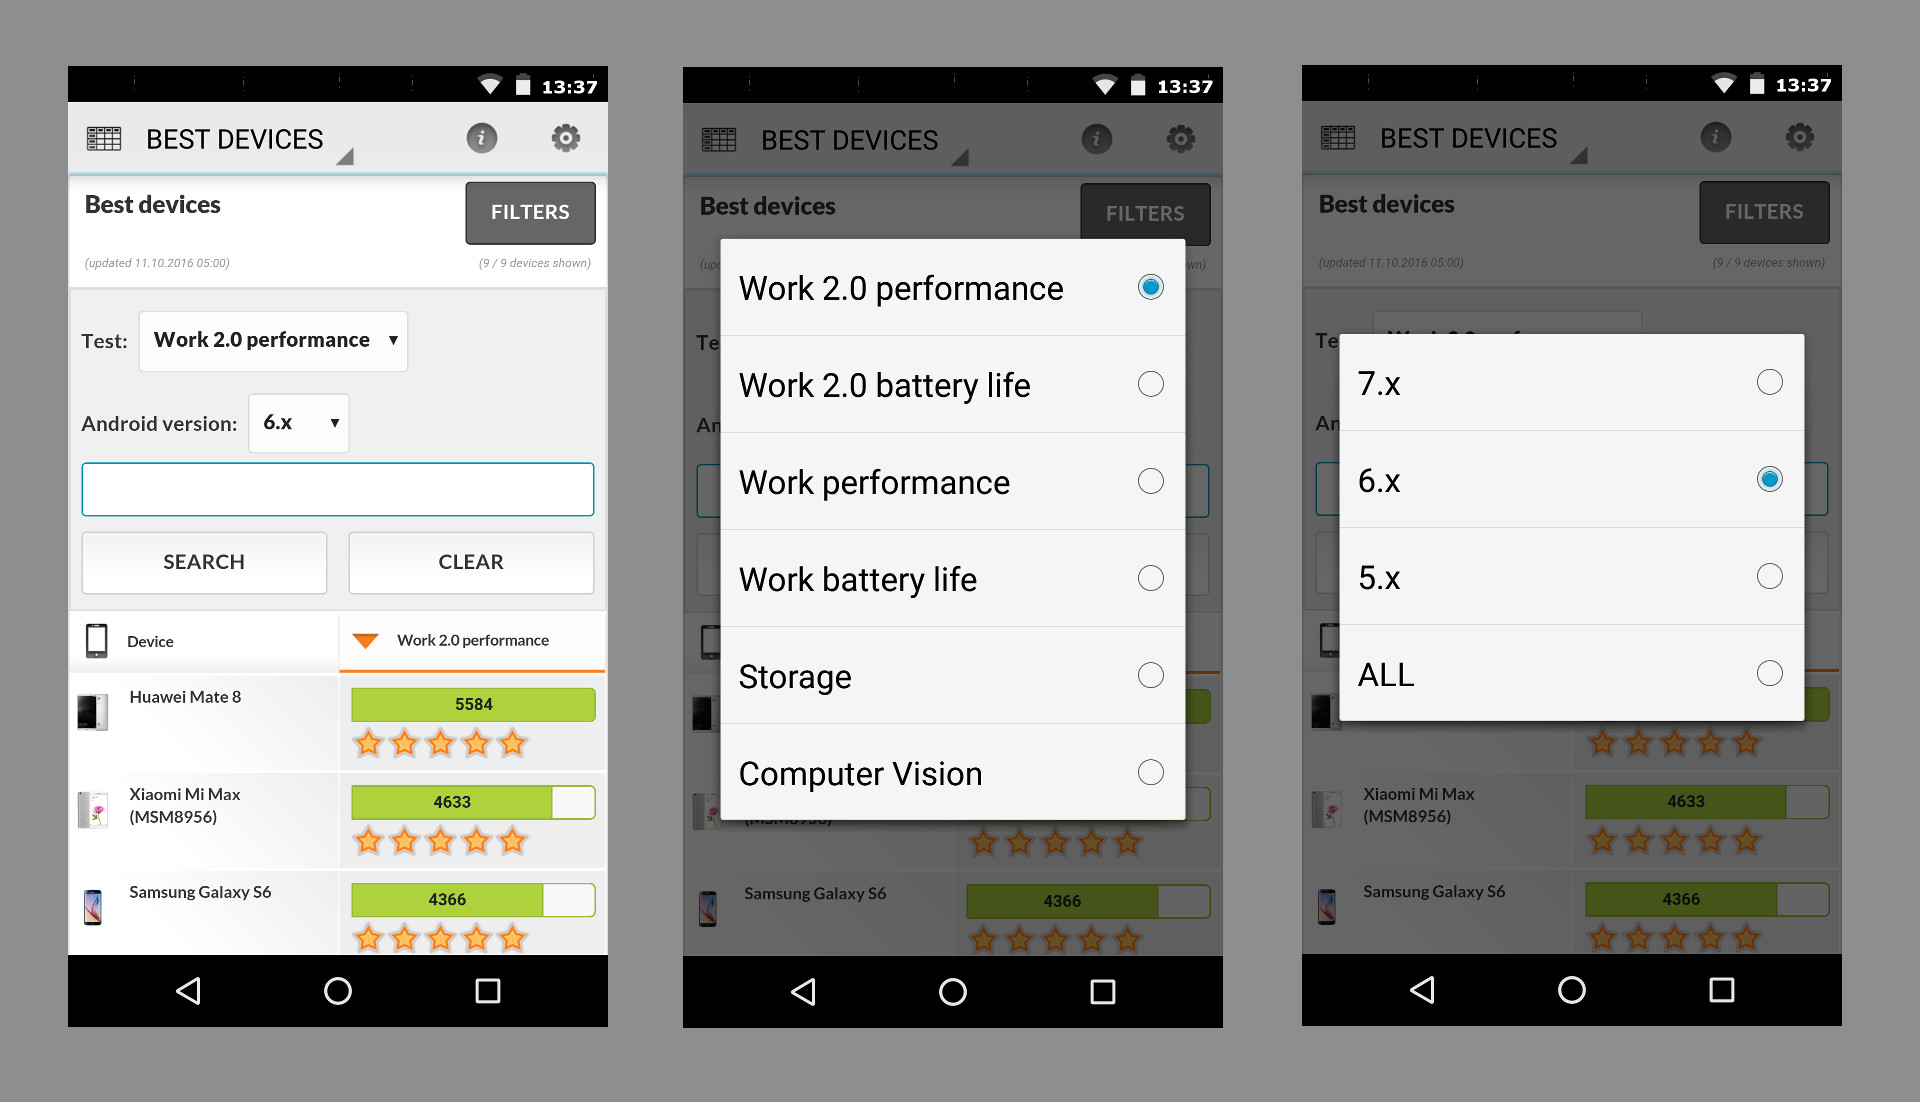
The in-app Best Devices screen is the ideal way to compare the latest smartphones and tablets. See which devices top the rankings for performance and battery life. This update gives you the option to filter the Best Devices list by a specific Android OS version. By default, the list shows scores from devices with the same Android OS version as your own device.
- Swipe left to the Best Devices screen.
- Tap the FILTERS button.
- Make a selection from the Test dropdown.
- Make a selection from the Android OS version dropdown.
It's easy to compare scores across Android OS versions for your own device.
- Swipe left to the Best Devices screen.
- Tap the FILTERS button.
- Use the Search box to find your device or another model you're considering.
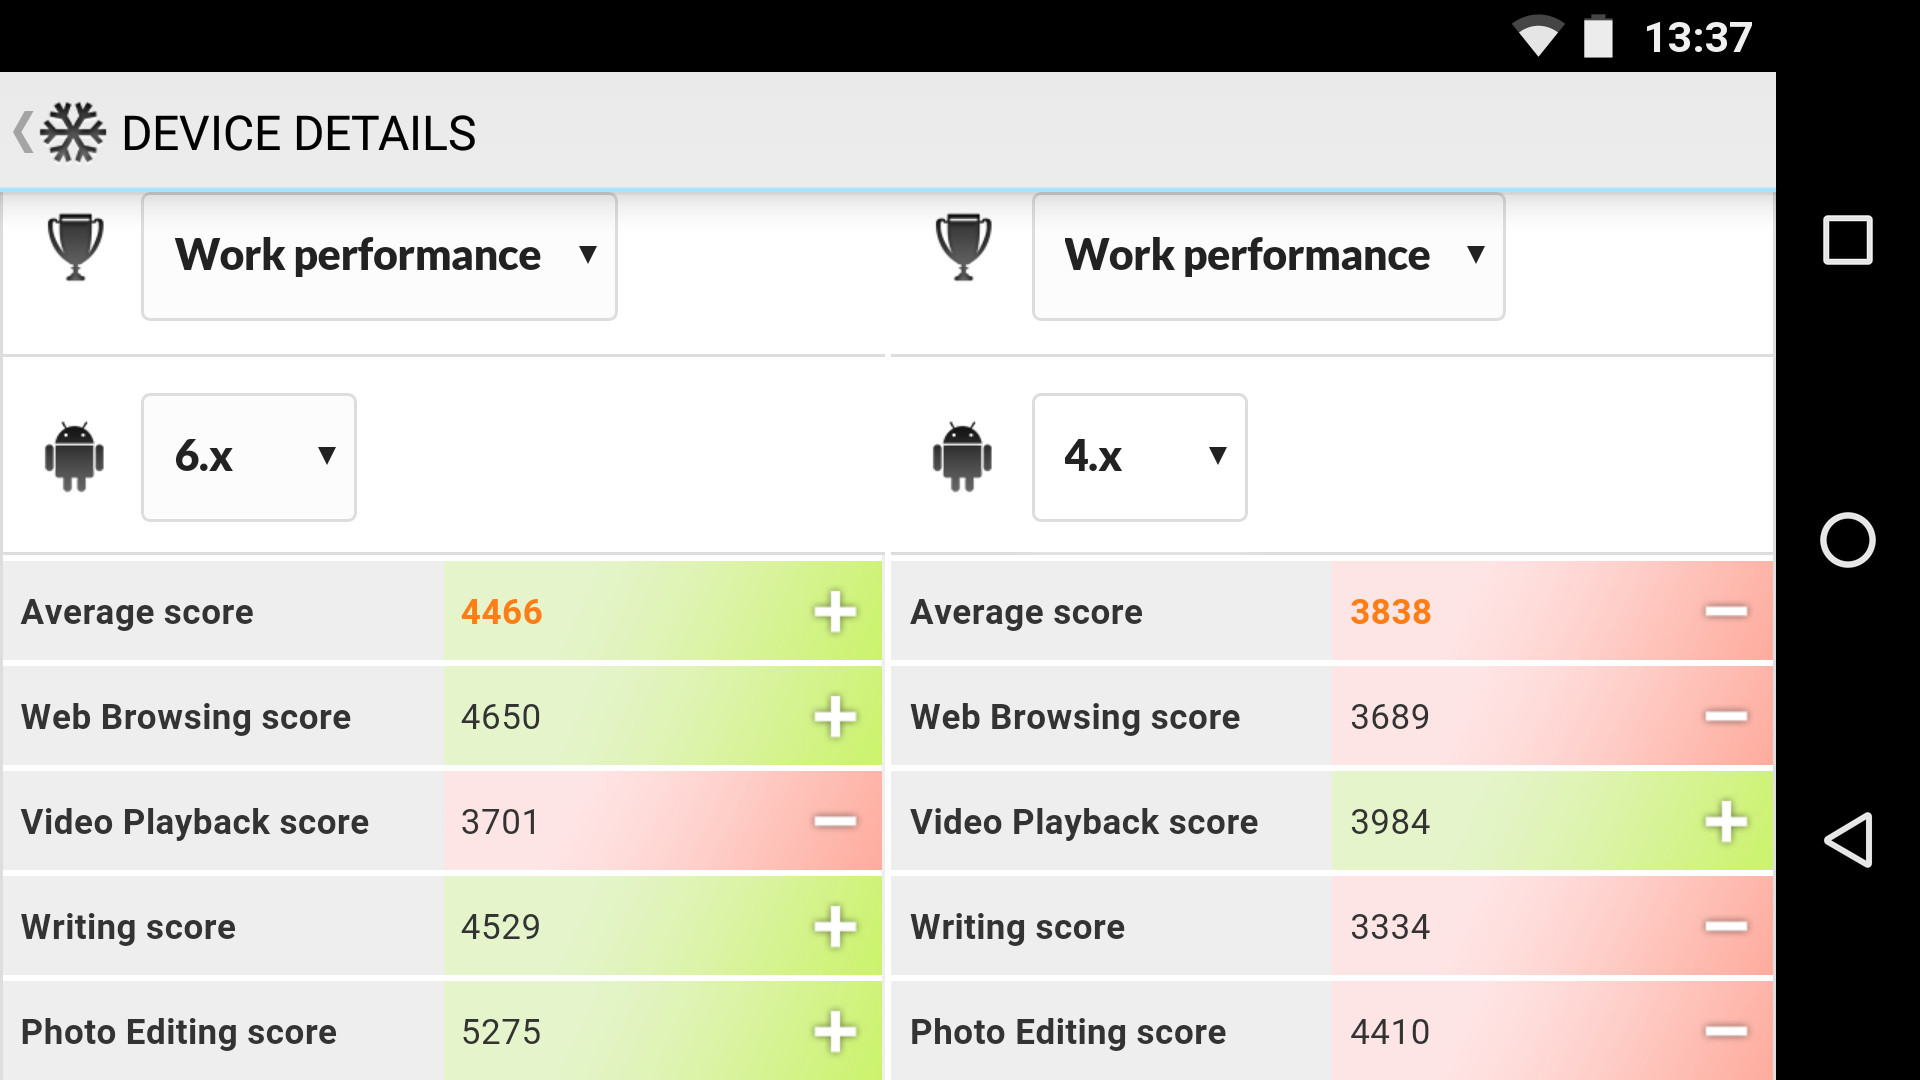
- Tap on the device to open the Device Details view. Landscape mode works best for this view.
- Scroll down, then select a benchmark test and Android version to compare scores.
Use this feature to see how scores have changed with each OS version upgrade, assess the difference in performance, and identify the areas with significant and modest performance changes.
You can choose any model from the Best Devices list and see a side-by-side comparison with your own device. Areas where the device is superior are highlighted green. Areas where it is inferior are shaded red.
Coming soon
PCMark for Android is a free benchmark app available now from Google Play. You'll be able to compare scores across Android versions after the update is released at 10:00 UTC on Thursday, October 13.
Recent news
-
Procyon Labs launches with FLUX.1 AI Image Generation Demo
November 4, 2025
-
3DMark Solar Bay Extreme is available now!
August 20, 2025
-
3DMark Speed Way Teams up with PC Building Simulator 2!
July 17, 2025
-
New Procyon AI Benchmark for Macs now available
June 25, 2025
-
3DMark for macOS available now!
June 12, 2025
-
New Inference Engines now available in Procyon
May 1, 2025
-
Try out NVIDIA DLSS 4 in 3DMark
January 30, 2025
-
Test LLM performance with the Procyon AI Text Generation Benchmark
December 9, 2024
-
New DirectStorage test available in 3DMark
December 4, 2024
-
New Opacity Micromap test now in 3DMark for Android
October 9, 2024
-
NPUs now supported by Procyon AI Image Generation
September 6, 2024
-
Test the latest version of Intel XeSS in 3DMark
September 3, 2024
-
Introducing the Procyon Battery Consumption Benchmark
June 6, 2024
-
3DMark Steel Nomad is out now!
May 21, 2024
-
Procyon AI Inference now available on macOS
April 8, 2024
